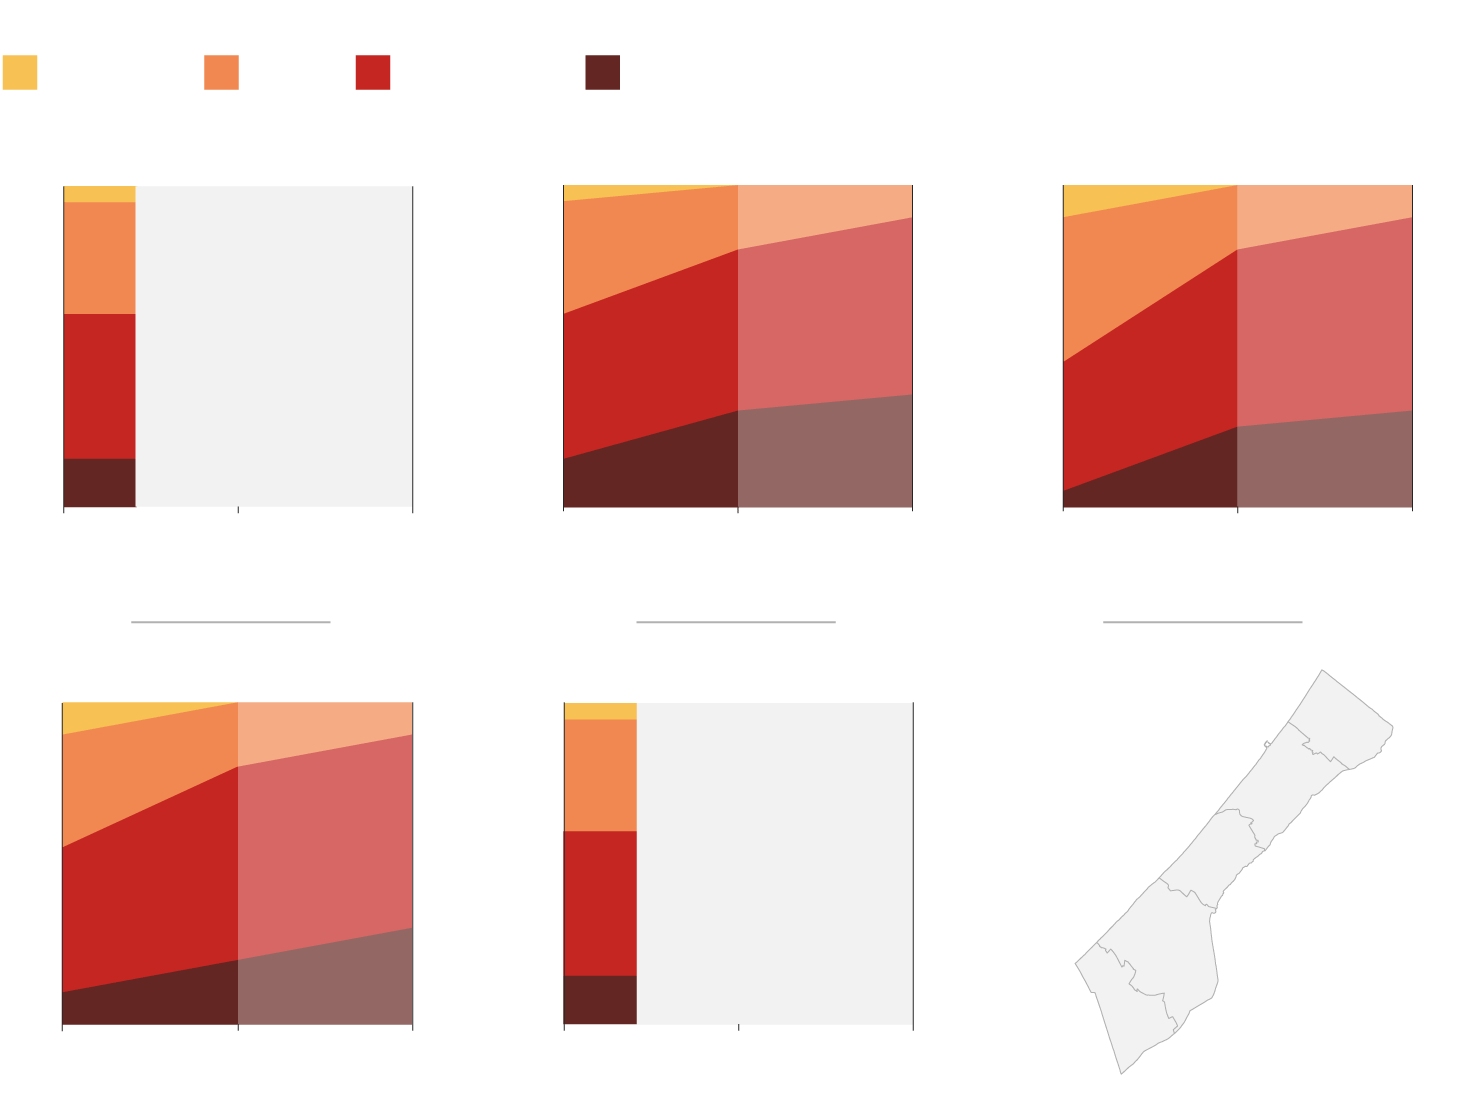
More than half a million people in Gaza are experiencing famine
The Integrated Food Security Phase Classification (IPC) estimated in mid-August that around a quarter of the population of around two million was experiencing starvation, with the number expected to have increased to a third by the end of September.

Proportion of population by food insecurity classification, by governorate
Stressed
Crisis
Emergency
Catastrophe/Famine
Gaza
North Gaza
5%
10%
5%
20%
35%
35%
Projection
Limited data
prevents classification beyond May 2025
55%
50%
45%
45%
30%
35%
15%
15%
1 July –
15 Aug.
16 Aug. –
30 Sept.
projection
1 April –
10 May
Deir al-Balah
Khan Younis
10%
10%
10%
10%
20%
20%
35%
45%
60%
60%
60%
55%
45%
40%
30%
30%
25%
20%
10%
5%
North
Gaza
Rafah
5%
35%
Not analysed
as indicators suggest area is depopulated
Deir
al-Balah
Gaza
45%
Khan
Younis
15%
Rafah

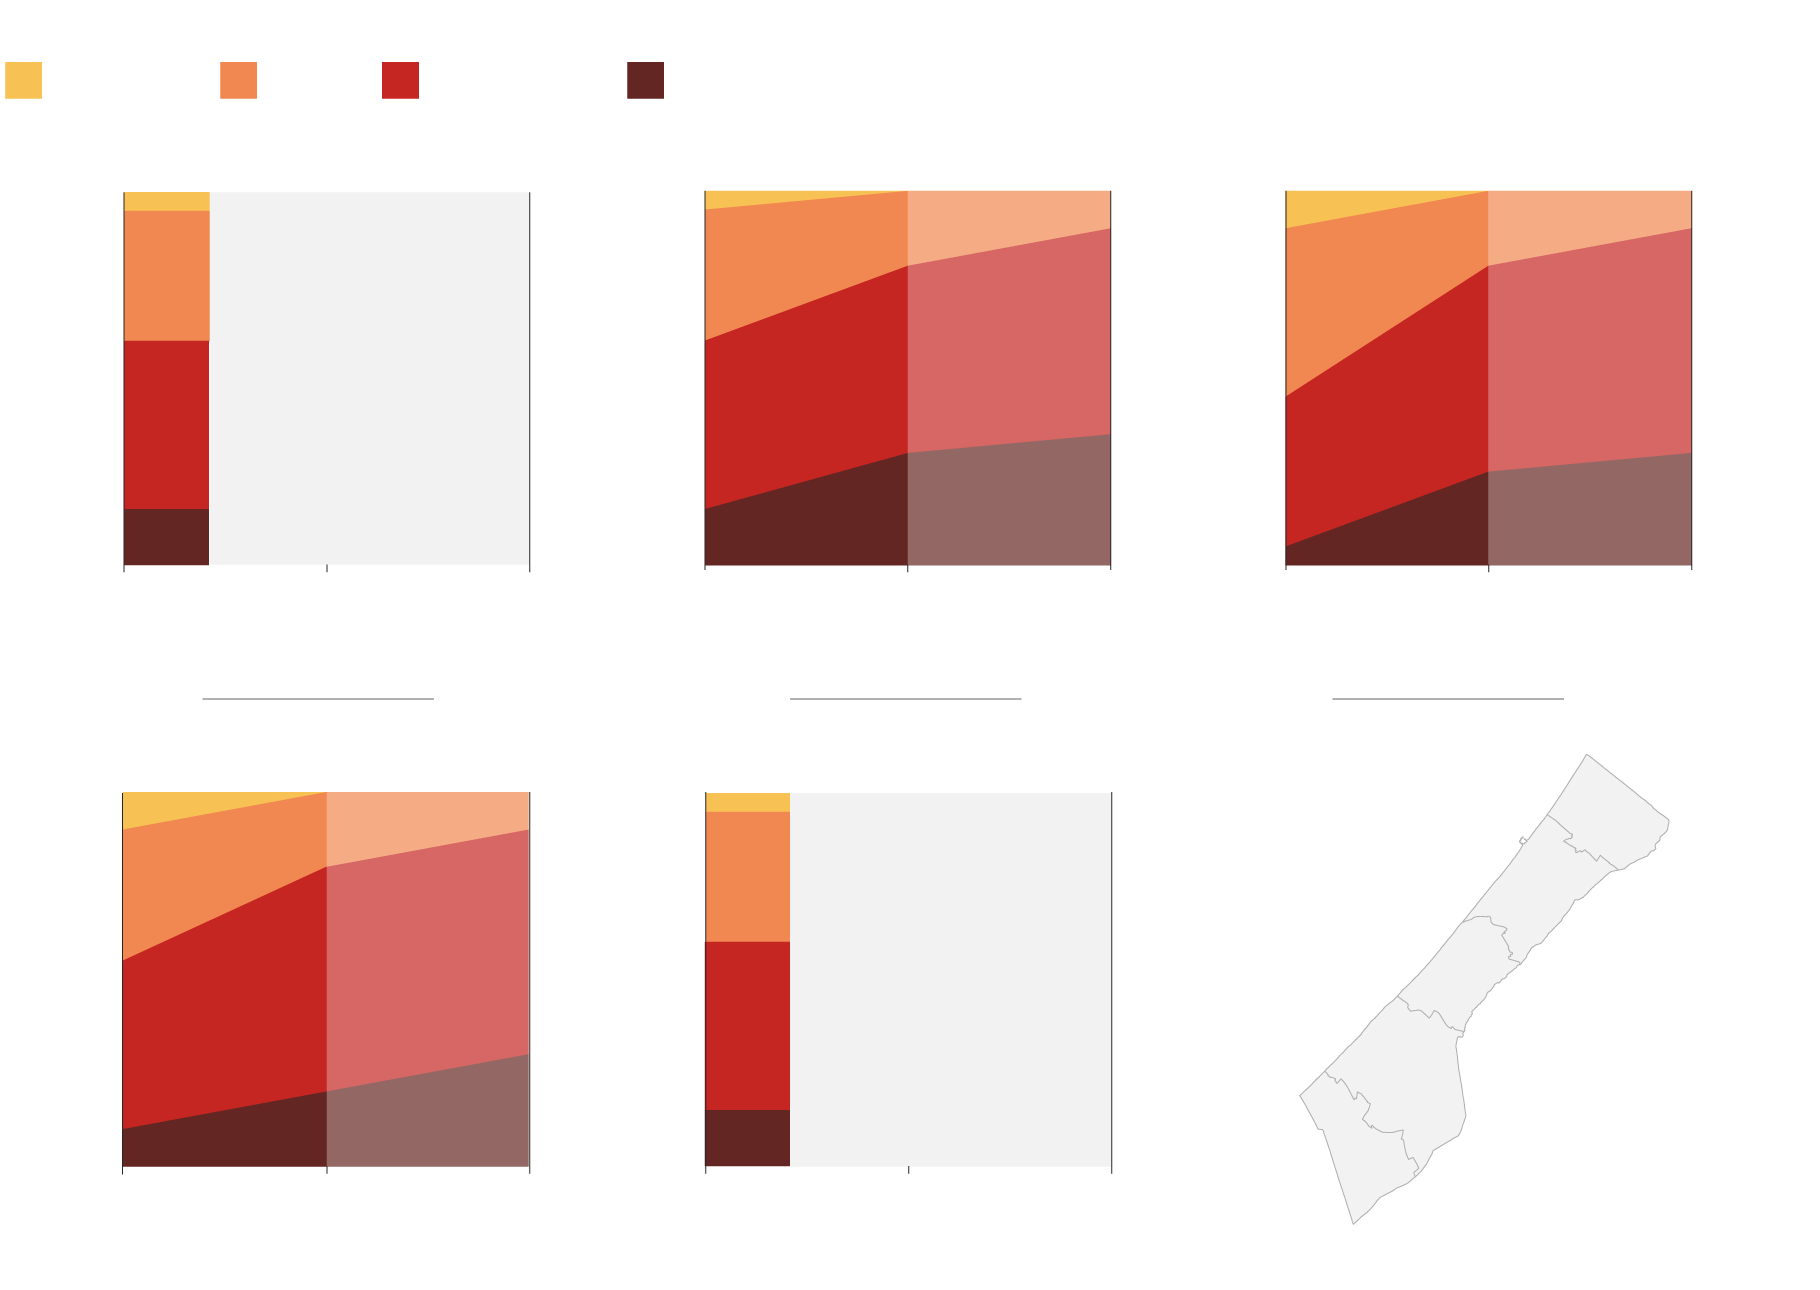
Proportion of population by food insecurity classification, by governorate
Stressed
Crisis
Emergency
Catastrophe/Famine
Gaza
North Gaza
5%
5%
10%
20%
35%
35%
Projection
Limited data
prevents classification beyond May 2025
55%
50%
45%
45%
30%
35%
15%
15%
1 July –
15 Aug.
16 Aug. –
30 Sept.
projection
1 April –
10 May
Deir al-Balah
Khan Younis
10%
10%
10%
10%
20%
20%
35%
45%
60%
60%
60%
55%
45%
40%
30%
30%
25%
20%
10%
5%
North
Gaza
Rafah
5%
35%
Not analyzed
as indicators suggest area is depopulated
Deir
al-Balah
Gaza
45%
Khan
Younis
15%
Rafah
Proportion of population by food insecurity classification, by governorate
Stressed
Crisis
Catastrophe/Famine
Emergency
Gaza
Deir al-Balah
North Gaza
5%
5%
10%
10%
10%
20%
20%
35%
35%
Projection
45%
55%
60%
Limited data
prevents classification beyond May 2025
50%
55%
45%
45%
40%
30%
35%
30%
25%
15%
15%
5%
1 July –
15 Aug.
16 Aug. –
30 Sept.
projection
1 April –
10 May
Khan Younis
Rafah
5%
North
Gaza
10%
10%
20%
35%
Gaza
35%
60%
Deir
al-Balah
Not analyzed as indicators suggest
area is depopulated
60%
45%
45%
Khan
Younis
30%
20%
15%
10%
Rafah
1 July –
15 Aug.
16 Aug. –
30 Sept.
projection
1 April –
10 May