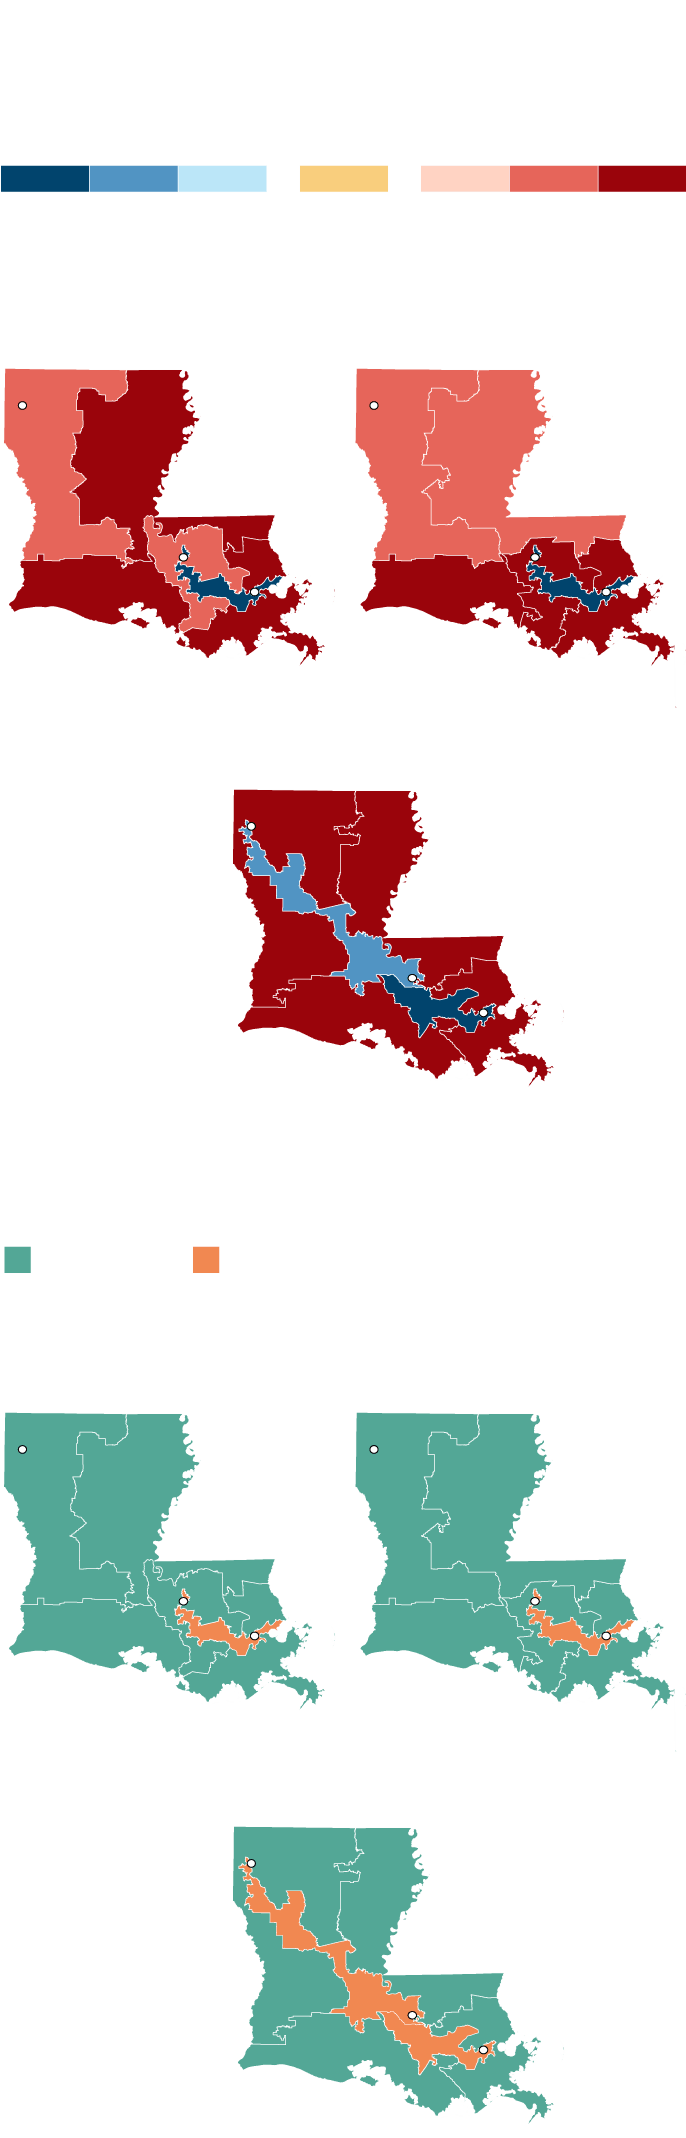
How congressional district lines have shifted in Louisiana
The Supreme Court rejected the map used in the 2024 election as an unconstitutional gerrymander ahead of the 2026 midterm election.

How Louisiana’s districts voted in 2020, by presidential vote margin, in percentage points
Republican
Democratic
Competitive
30+
15+
5+
Within 5
5+
15+
30+
Old map
Redrawn map
Used in the 2020 election
Used in the 2022 election
Shreveport
Baton Rouge
New
Orleans
Rejected map
Used in the 2024 election
Group that represents the majority in each Louisiana district
Black
White
Old map
Redrawn map
Used in the 2020 election
Used in the 2022 election
Shreveport
Baton Rouge
New
Orleans
Rejected map
Used in the 2024 election
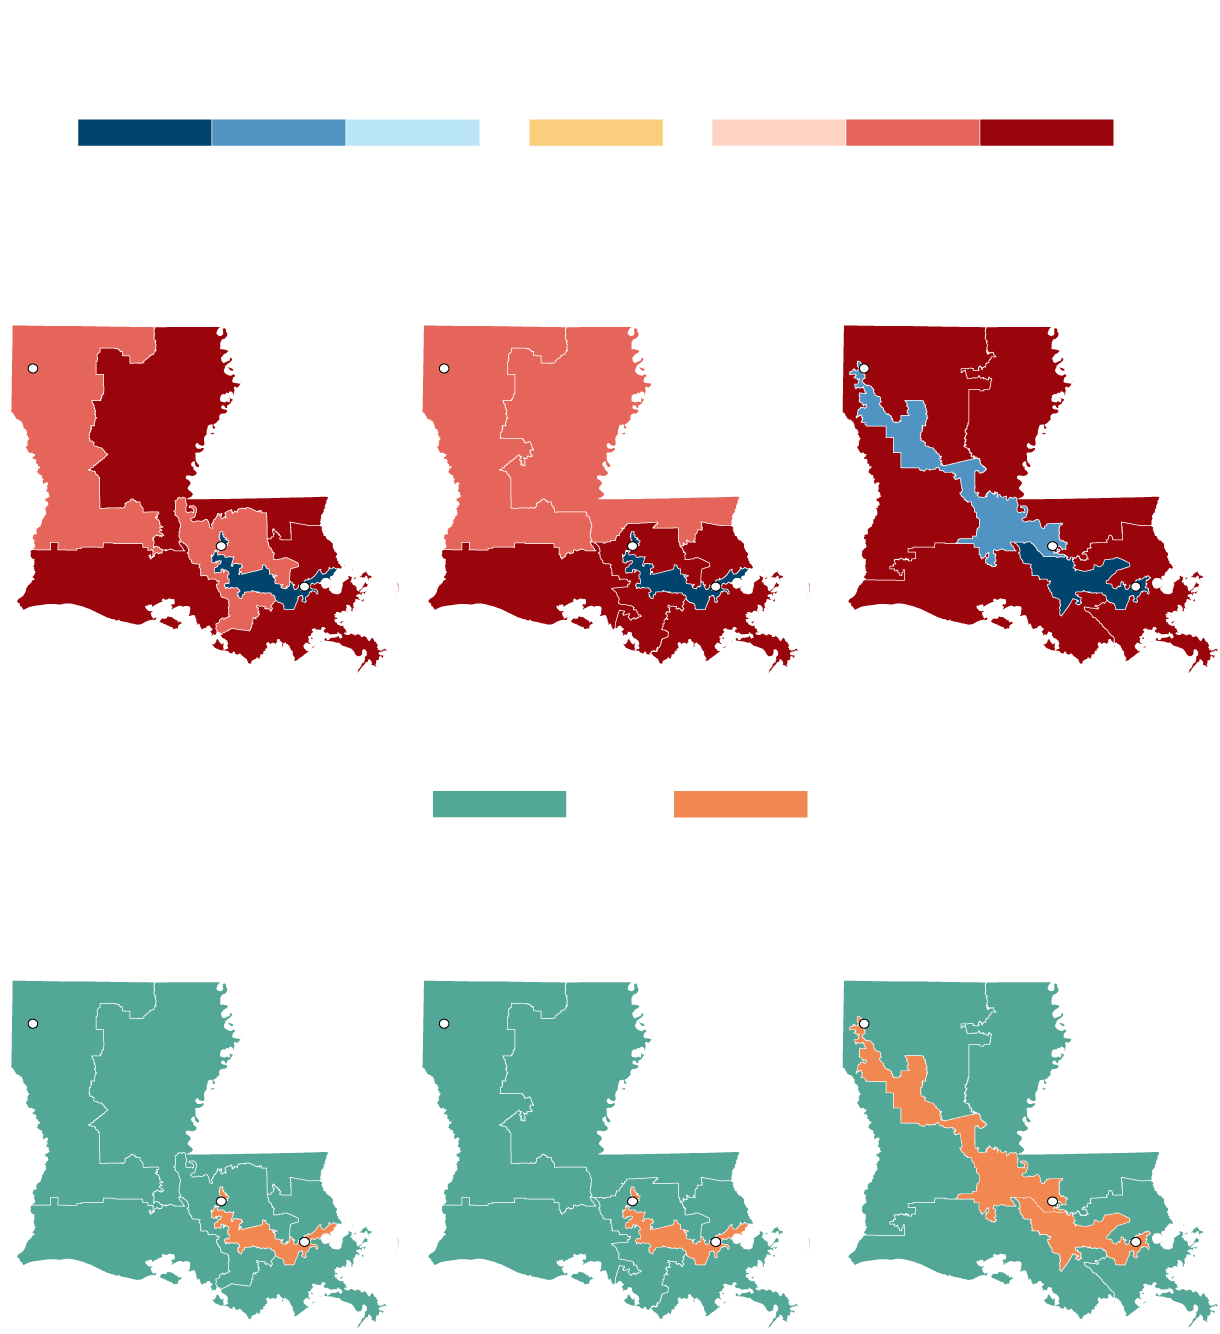
How Louisiana’s districts voted in 2020, by presidential vote margin, in percentage points
Republican
Democratic
Competitive
30+
15+
5+
Within 5
5+
15+
30+
Old map
Rejected map
Redrawn map
Used in the 2020 election
Used in the 2022 election
Used in the 2024 election
Shreveport
Baton Rouge
New Orleans
Group that represents the majority in each Louisiana district
White
Black
Old map
Redrawn map
Rejected map
Used in the 2020 election
Used in the 2022 election
Used in the 2024 election
Shreveport
Baton Rouge
New Orleans
